
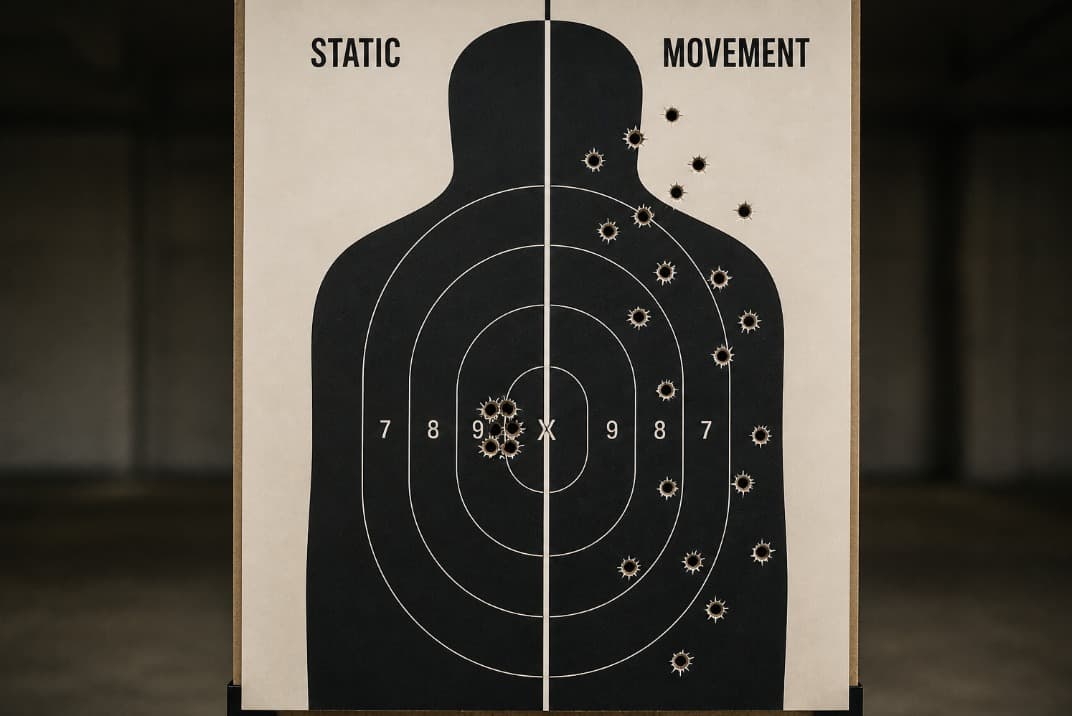
Most qualification programs are designed to answer one question: did the shooter pass? That’s an administrative question, not a training question. The difference matters enormously, and a dataset of 545 pistol qualification runs collected across twelve organizations over ten years makes the gap impossible to ignore.
The data covers a 50-round, 9mm qualification course administered between 2012 and 2022 across a cross-section of public and private security organizations. Five scored stages: ETP (static), UNA (one-hand), REAC (reaction fire), MOV A and MOV B, each scored out of ten. Two hundred fifty-nine unique shooters. Forty sessions. What the numbers reveal should concern any training director who takes qualification seriously.
The Gap Nobody Is Closing
The headline finding is not subtle. Static performance averaged 8.64 out of 10. One-hand averaged 8.41. Reaction fire, 8.25. Then both movement stages averaged 7.57. Figure 1 makes the gap impossible to argue with: a full point of separation, consistent across 545 runs and ten years, that never closed.
Figure 1. Mean score by stage, all years and entities combined. The static-to-movement gap replicates without exception across the full decade
The standard deviation data sharpens the picture. Static stages showed variability of 1.76 to 1.84. Movement stages ran 2.18 to 2.19, not only lower on average, but more erratic. Some shooters execute movement strings well. A substantial cohort hemorrhages points there, and the qualification format, which weights all five stages equally, buries it in the total score.
The rate of perfect 10s confirms the direction: 44% of shooters posted a perfect ETP stage. On both movement stages, that number fell to 23–25%. If a qualification course is meant to simulate conditions of use, the movement stage is the most honest test of whether that simulation is producing anything durable. Right now it is the stage where training most consistently fails to close.
Static performance averaged 8.64/10. Movement averaged 7.57. That gap isn’t an outlier. It replicates across every year in the dataset.
Understanding why the gap exists matters as much as knowing it does. Static training builds precision in isolation: stable platform, predictable sight picture, no competing demands. Movement removes all three simultaneously. Footwork, balance, shifting visual field, trigger control, these are not additive skills. They form an integrated system that must be trained as a system. Most programs never do. They run the bulk of live-fire repetitions on static strings, then expect the precision to transfer. It does not. The movement gap is not a mystery. The predictable output of a training design that has never matched its stated purpose.
A Decade Is Long Enough to See the Pattern
Annual mean scores ranged from 34.37 in 2013 to 43.92 in 2017, an oscillation of nearly ten points across the decade. Figure 2 shows the collapse pattern clearly: the down years are not evenly distributed failures. They have a signature.
Figure 2. Annual mean score (line) and pass rate (bars), 2012–2022. The worst years, 2013 and 2016, share a common profile: movement stage scores collapse while static scores hold.
In 2013, movement scores on MOV B averaged just 5.42. In 2016, 36.37 mean, 56.1% pass rate, MOV A averaged 5.85. In both cases the degradation concentrated in dynamic performance while static stages held relatively steady. A training deficit signature. Not a range-conditions problem.
The 2017 peak is equally instructive, and raises questions training directors should be sitting with. Mean score of 43.92. Movement stages averaging 9.00 and 9.46. Something changed in the training pipeline feeding those sessions. Was it a curriculum shift toward dynamic volume? An instructor intervention targeting movement fundamentals? A cohort that arrived better prepared? The data cannot say. But the question is worth asking of your own program: when was your last year that looked like 2017, and what was different about it?
The Organizations Getting It Right. And the Ones That Are Not
Across twelve entities, mean scores ranged from 35.40 to 44.00, an 8.6-point spread across organizations all shooting the same course. Not about ammunition or course difficulty. Training culture.
Group GG led the dataset: 100% pass rate across 18 runs, mean score of 44.00. Group HH: 60% pass rate, 35.40 mean. Six in ten shooters clearing the standard is not a qualification program. A formality with a clipboard. Group II ran 95 qualification attempts at a 67.4% pass rate. One in three failing the minimum standard across a documented history. With 95 runs in the dataset, not a blip. An organizational profile.
The high performers, GG, FF at 89.2%, KK at 90.0%, LL at 92.3%, EE at 92.7%, are not uniformly the highest scorers. What distinguishes them is that they have eliminated below-standard outcomes. The bottom-tier organizations have not, and the qualification record makes that visible to anyone who looks.
Repeat Shooters and the Regression Nobody Caught
Of 259 unique shooters, 134 appeared two or more times. Among the 84 with three or more recorded appearances, the average score change from first to final qualification was +2.87 points. That sounds like progress. The distribution underneath it does not.
57.1% of repeat shooters improved. 40.5% declined. Not gradually. Several dropped 11 to 18 points between first and last appearance. The worst regression: 48/50 to 30/50 across three sessions. Not a bad day. A documented trajectory of skill atrophy that the qualification format recorded while no intervention addressed it.
40.5% of repeat shooters declined over their qualification history. One went from 48 to 30 across three sessions. Not variance. Drift, and the system that recorded it never triggered a response.
The best progression counters it: 24/50 to 49/50 across three sessions, a 25-point gain that reflects serious training investment. The instrument was sensitive enough to capture both trajectories. The question is whether anyone was watching either one.
What the Data Is Actually Telling You
The movement gap is real. The organizational spread is real. Every one of these findings is a finding about scores, numbers written down after observing a target. What happened on that target never survived the recording process.
Three metrics should be non-negotiable in any serious qualification review: the movement stage mean reported as a standalone figure, not absorbed into a total; the pass rate disaggregated by stage, not reported as a single number; the longitudinal trajectory of repeat shooters with a defined threshold that triggers mandatory review. Most programs track none of these. They count passes and close the file.
A qualification system that only records scores cannot produce training outcomes. Administrators can use it to infer them, occasionally stumble onto them. No mechanism exists for diagnosing failure at the level where failure actually occurs.
If your qualification records were audited tomorrow, not the pass/fail outcomes, but the evidentiary basis for those outcomes, what would the audit find?
The organizations in this dataset range from 100% pass rates to 60%. All shooting the same 50-round format. Not producing the same outcome. Training culture explains the spread, and training culture is a leadership variable. What does yours look like?